Another Way To Predict The Election
I am often daunted by the sheer number of ways to look at polling. I am a bit of a polling skeptic, relying on vibes to help me interpret the polls like everyone does, but with a bias to not really believing any of it.
Polls are an attempt to gather low-level information and make it mean something, but I have always liked to look at things from both sides. In chemistry, the analogy would be kinetics and thermodynamics. Each gives insight in different ways. So here is more of a top-down look at predicting the election. Michael Podhorzer is the former political director of the AFL-CIO.
Kamala Harris will win the national popular vote on November 5th, absent an extraordinary upending event. Here’s how we know. In the MAGA Era (post-2016), the best predictor of how—and whether—someone will vote in the future is how—and whether—they have voted in the past.— Michael Podhorzer (@mikepod.bsky.social) September 26, 2024 at 7:45 AM
Today, there are about 91 million Americans who have voted for Biden and House Democrats since 2016, and about 83 million who have voted for Trump or House Republicans.— Michael Podhorzer (@mikepod.bsky.social) September 26, 2024 at 7:45 AM
If this pool of voters votes that way again, and if they constitute 80 percent of those voting in 2024 (a fairly conservative assumption), then the other 20 percent of voters would have to favor Trump by 18 points for him to overcome that deficit.— Michael Podhorzer (@mikepod.bsky.social) September 26, 2024 at 7:46 AM
Even if Harris only wins the already-voted by half as much as Biden did, that would mean Trump needs to win first-time voters by 9 points in order to win the popular vote. There’s just no evidence that he could pull off anything close to that.— Michael Podhorzer (@mikepod.bsky.social) September 26, 2024 at 7:46 AM
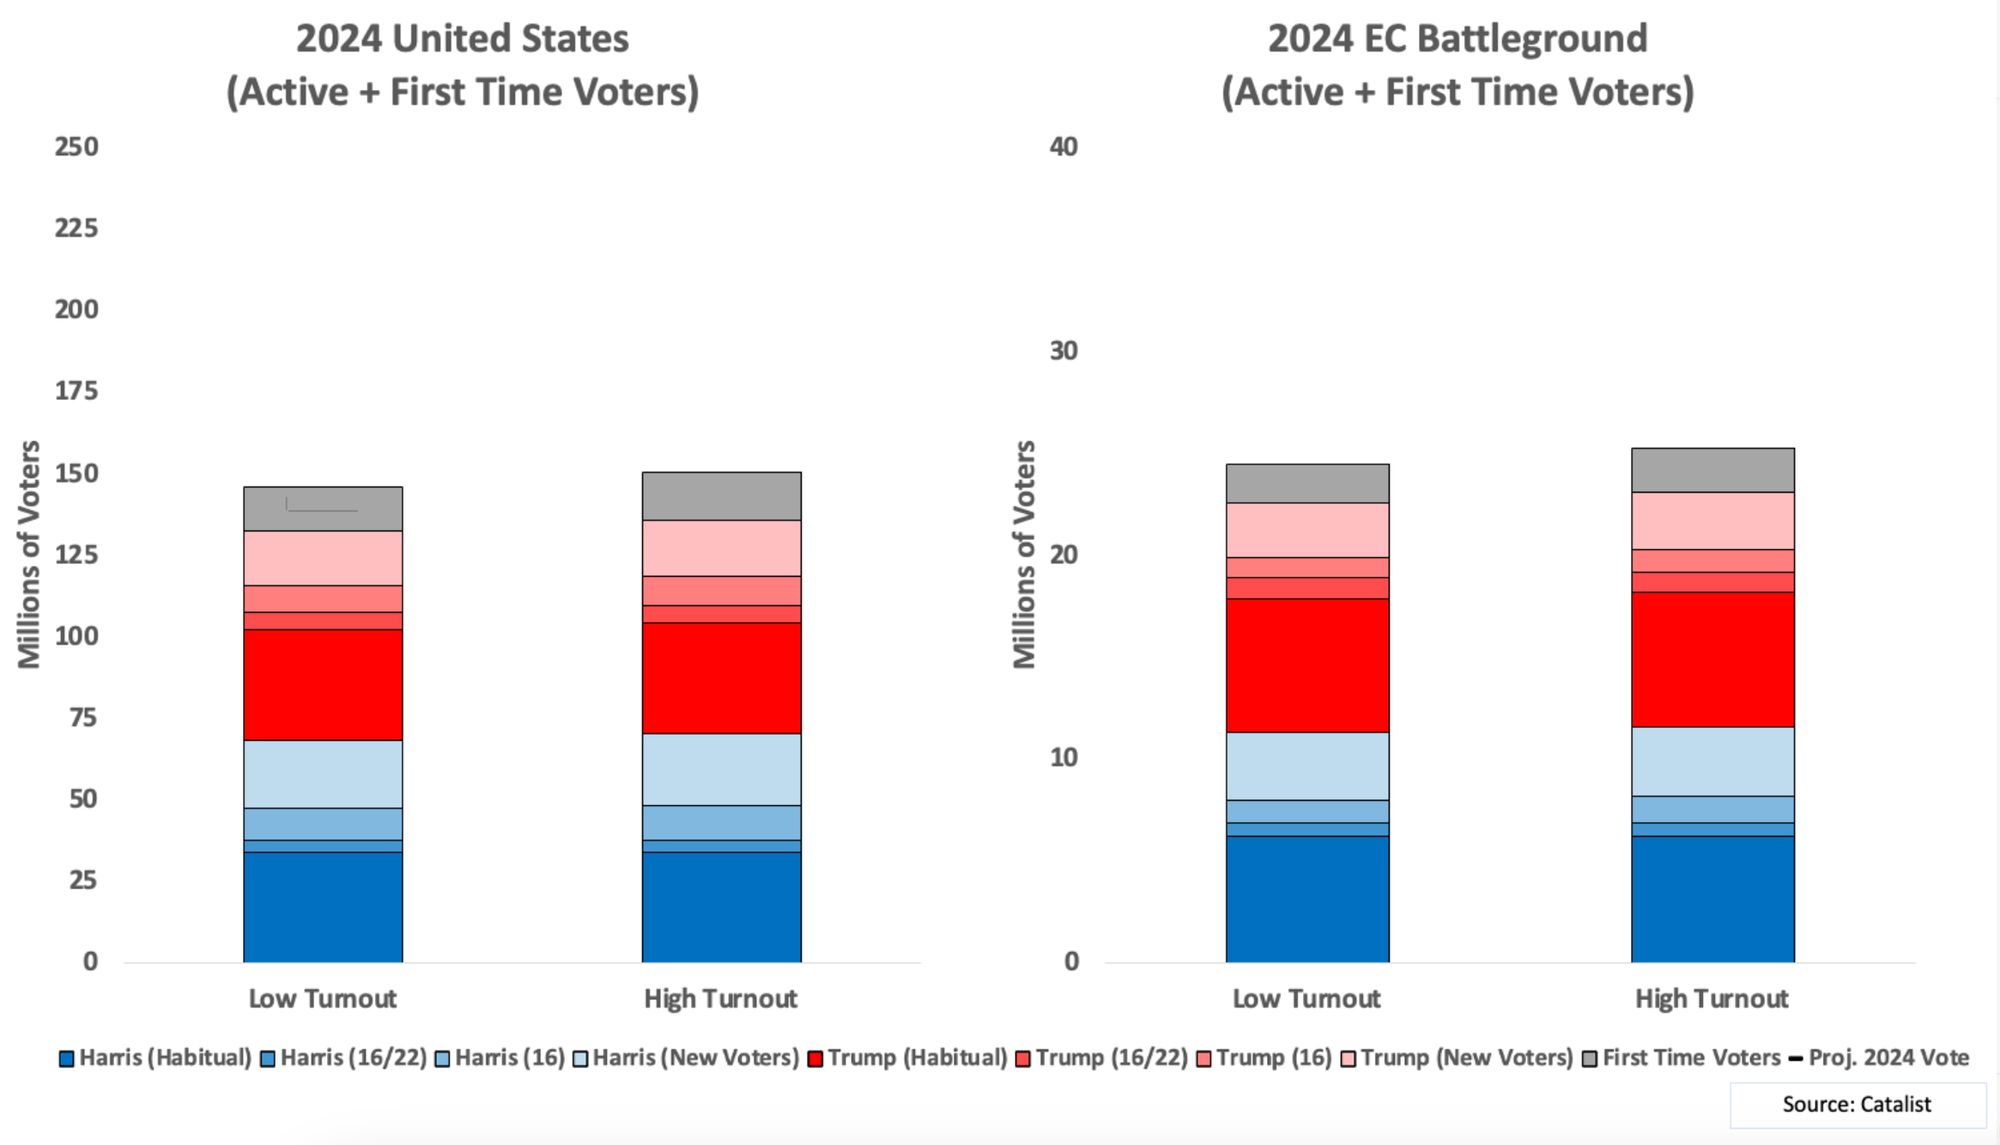
In my new analysis, I segment the electorate by vote history, using recent historical trends of how frequently those groups turn out in the next presidential election, to construct a model of who we can expect to vote in 2024. www.weekendreading.n…
[image or embed]— Michael Podhorzer (@mikepod.bsky.social) September 26, 2024 at 7:46 AM
The result is this chart, which is probably confusing at first glance. The red- and blue-shaded boxes represent the voter blocs we can expect to vote for Trump and Harris, respectively. The gray represents first-time voters whose partisanship we can’t yet know.
[image or embed]— Michael Podhorzer (@mikepod.bsky.social) September 26, 2024 at 7:46 AM
Here’s the image from the posts – Bluesky allows embeds, but not quite as completely as Twitter.